Equiligraph: Titration

An app to get you further than you’d hoped,
in less time than if you’d guessed
This app provides numerical and graphical solutions for proton acid-base equilibria problems involving up to four protons. The fundamental tool is the Equiligraph which is a time tested and long forgotten tool. Graphical solutions are found quickly and easily.
The purpose of this tool is to re-introduce the Equiligraph. It is both a teaching tool and a reference tool, which students will grow into, but not grow out of. Practitioners will find this a labor saving aid, which permits them to perform analyses which are generally too complex and time consuming for most industrial and research problems.
Who would find this app useful?
-
*Professionals: chemists, biologists, chemical engineers and material scientists.
-
* Laboratory Technicians
-
*Students taking an introductory course in chemistry
-
*Chemistry majors
-
*Graduate students
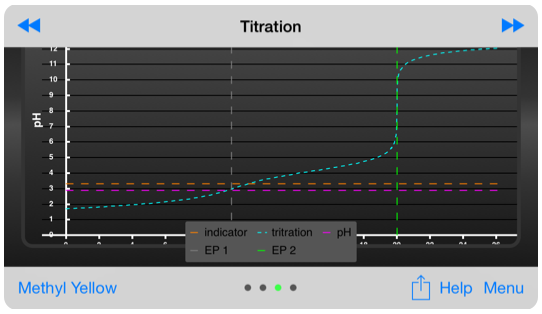
First end point for 0.16 (M) oxalic acid, using methyl yellow indicator
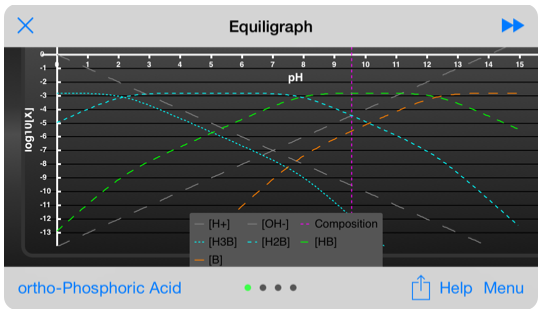
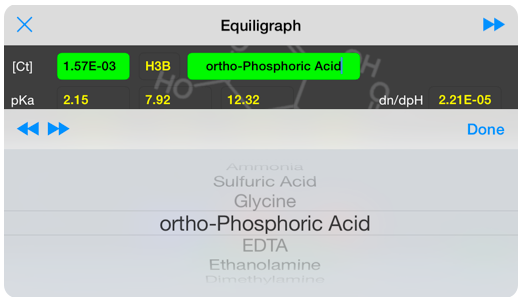
The equiligraph page for ortho-phosphoric acid: H3PO4 . The vertical line shows the system pH and it’s intersection with the composition lines gives the concentration of the various components at that pH.
More than 80 molecules are accessible through a drop-down list.
Extensive help and instructions, which includes a rigorous discussion of the appropriate physics.
A slider positions a line showing pH on all three graphs, so you can quickly correlate the information provided by each graph.
A suite of predefined analyses are available as a drop-down list, and serve to quickly orient you so that you obtain the information you need. The predefined analyses include pH of solutions made from pure acid, and various stoichiometric salts ( e.g monobasic, dibasic, etc), the endpoint of titrations for each stoichiometric salt and the titration mid-points.
Only two simplifying assumptions are used:
-
*The contribution of [H] and [OH] due to the dissociation of water are neglected
-
*Solutions are ideally dilute ( activity coefficient = 1) .
Corrections for both assumptions are simple to derive and apply.
More than 80 molecules are accessible through a drop-down list. Included are typical mineral acids, representative molecules for common organic functional groups, the essential amino acids, the 5 bases present in DNA and RNA and a range of pH indicators commonly encountered in laboratory titrations.
Examination of these examples in this app will benefit the novice chemist and seasoned professional, providing inspiration and insight, as well as the occasional epiphany.
Each of these molecules can be used as the starting point for ‘what if’ scenarios, including changing the pKa to represent a different molecule or even adding an additional pKa while in ‘Explore’ mode.
NOTE: You can download a free version, which restricts access to a small number of molecules and blocks the use of “Explore’ mode. This is to allow you to decide if this app has any value to you.
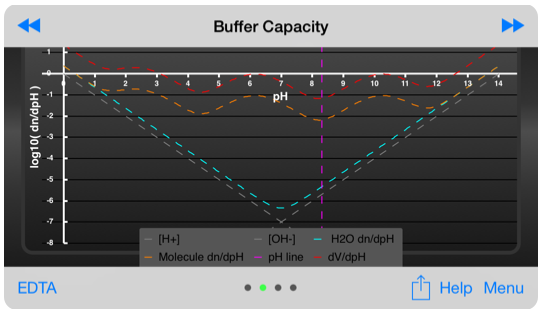
Buffer capacity display, showing the typical buffer capacity and the volume of titrant required to change the pH of the test solution by 1 pH unit.
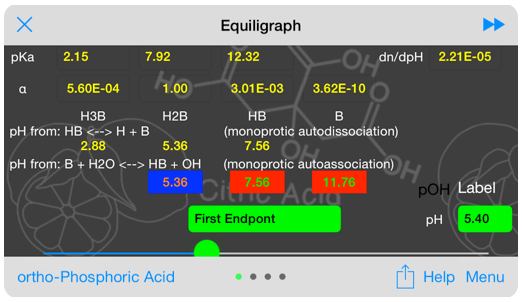
Numeric results displayed include the relative fraction of each form present at the system pH, the typcial monoprotic analysis of autodissociation and endpoint ( auto association) and the buffer capacity.
The buffer capacity is displayed using a non-traditional graph, which compares the buffer capacity of the molecule to that of pure water. The concentration of the solution is freely variable using inputs on this page.
The traditional buffer capacity is a useful, but abstract, so the buffer capacity is also displayed showing the volume of titrant needed to change the pH by one unit using the titration conditions defined on the titration page.

Buffer capacity inputs. Not shown are the pH input, the analysis input and the pH slider.
The titration graph is perhaps the most important for novice users of this app because it ties the equiligraph and buffer capacity charts to the real-world laboratory data that all chemistry students encounter - the titration. It’s importance decreases as one becomes more familiar with the equiligraph.
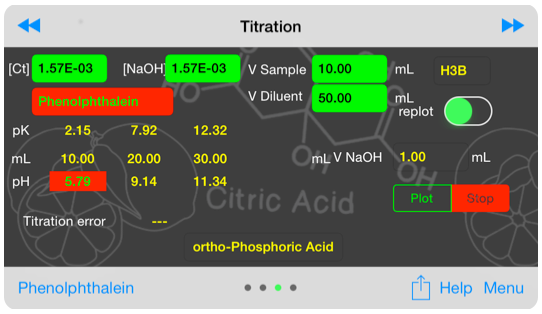
Inputs for titration graph.
Titration curves are sensitive to concentration of the analyte and titrant. Changing these concentrations provides insight into real-world behavior.
A range of acid base indicators is available, and the titration error associated with using a given indicator for a specific endpoint is provided. Additionally, the user is warned if the selected indicator is inappropriate.
This particular graph is a wonderful ‘what if’ tool, which provides much insight and can save much wasted effort in the laboratory by refining titration conditions by performing a quick ‘dry lab’.
The titration curve is a 3rd order polynomial in [H] for a monoprotic acid and 6th order in [H] for a tetraprotic acid. The titration curve is computed using a complex iterative algorythm. The resulting graph may show non-physical discontinuities.
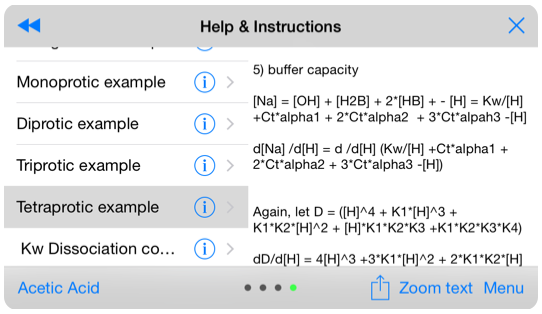
The help section provides a rigorous derivation of the coupled equations representing mono-, di-, tri- and treta-protic acids. Most text books used in undergraduate chemistry classes cover monoprotic systems, but generally do not attempt to show the full treatment for diprotic systems. As such, this help section is an invaluable reference for real-world problems.
Selected data for these example molecules is provided in text form.
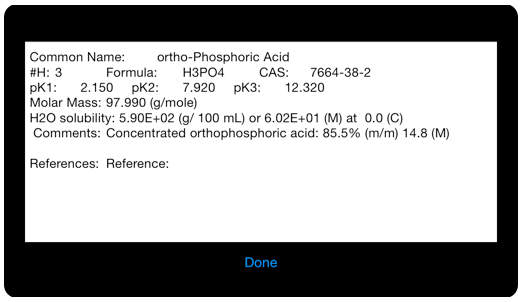
Selected data is provided for each of the example molecules.
A suite of predefined analyses are available as a drop-down list, and serve to quickly orient you so that you obtain the information you need. The predefined analyses include pH of solutions made from pure acid, and various stoichiometric salts ( e.g monobasic, dibasic, etc), the endpoint of titrations for each stoichiometric salt and the titration mid-points.
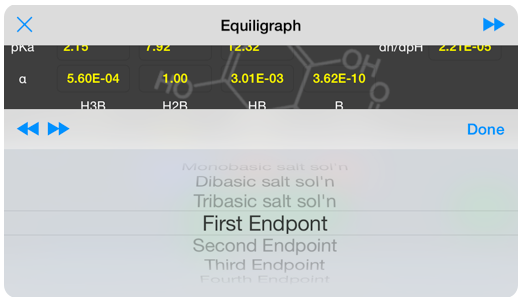
13 common analyses predefined orient you as you explore.
Keywords: Chemistry, Acid, Base, Equilibrium Constant, Ka, Kb, K1, Ionic, Aqueous, Weak, Strong, Titration, Buffer Capacity, alpha, End point, Equivalence point, pH, pKa, pKb, pK1,Composition, Mass Balance, Charge Balance, Coupled Equations, Graphical, Numerical Solution, Monoprotic, Diprotic, Triprotic, Tetraprotic.
A half an hour with this app
will save you an afternoon in the library,
or six months in the laboratory!
I have been using equiligraphs to solve analytical chemistry problems in research and industrial settings for over 30 years. They have saved me much time and effort - showing me blind alleys and dead ends.
I have found that equiligraphs are especially useful for showing non-chemists what the consequences of altering conditions can be. Graphs are more readily understood than equations or words.
This app is highly interactive. Three graphs, which show complimentary views of the same system, provide a unique perspective on the system and its behavior. These three views are:
-
*Equiligraph, which shows composition as a function of pH
-
*Buffer capacity, which shows the resistance of the solution to pH changes
-
*Titration graph, which provides a laboratory bench perspective of the data in the other two graphs
Quick Links;
Tutorials / Interpretation:
Worked examples:
Physics / Theory:
Software / Apps:
Titration: Apple AppStore
Equiligraph, buffer capacity and titration curve.

** Not yet available!
A calculator showing CaCO3 solubility as a function of atmospheric CO2

**** Not yet available1
Equiligraph showing solubility as function of pH